import numpy as np
import matplotlib.pyplot as plt
%matplotlib inline
# 그래프가 주피터 안에서 그려진다는 의미
- 그래프 데이터 생성

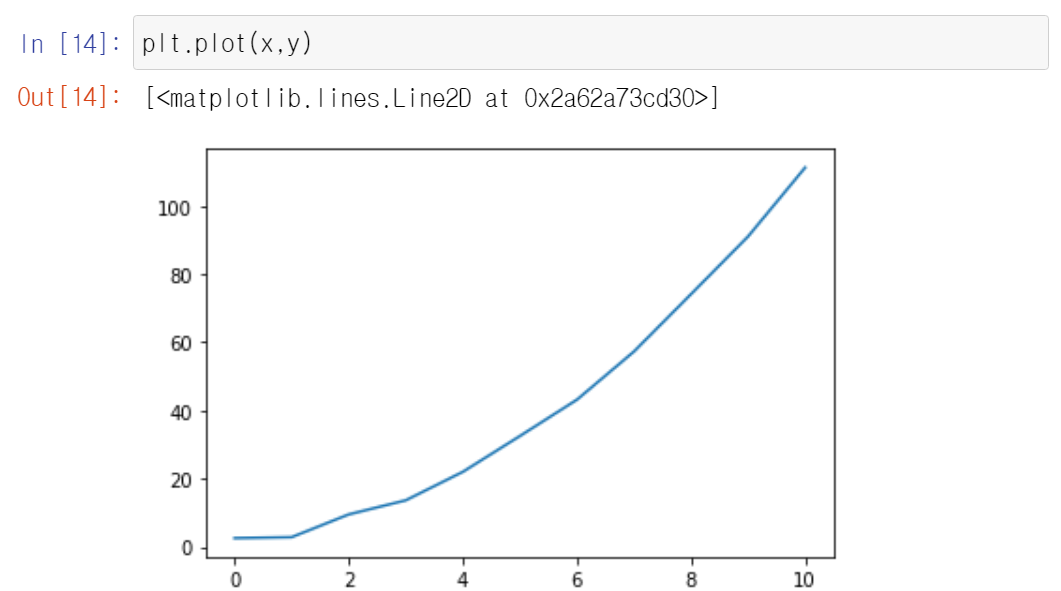
- 그래프 출력하기
- plot함수 (선 그래프), scatter(점 그래프), hist(히스토그램) 등 사용
- 함수의 parameter 혹은 plt의 다른 함수로 그래프 형태 및 설정을 변경하능
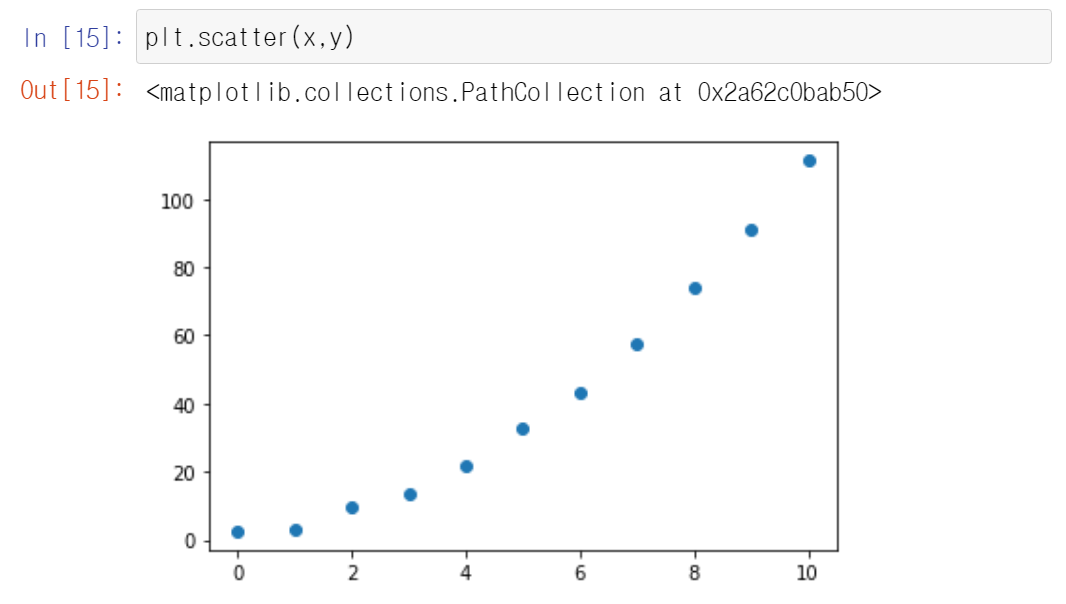
- 기본적으로 x,y에 해당하는 값이 필요
- plot함수 (선 그래프), scatter(점 그래프), hist(히스토그램) 등 사용
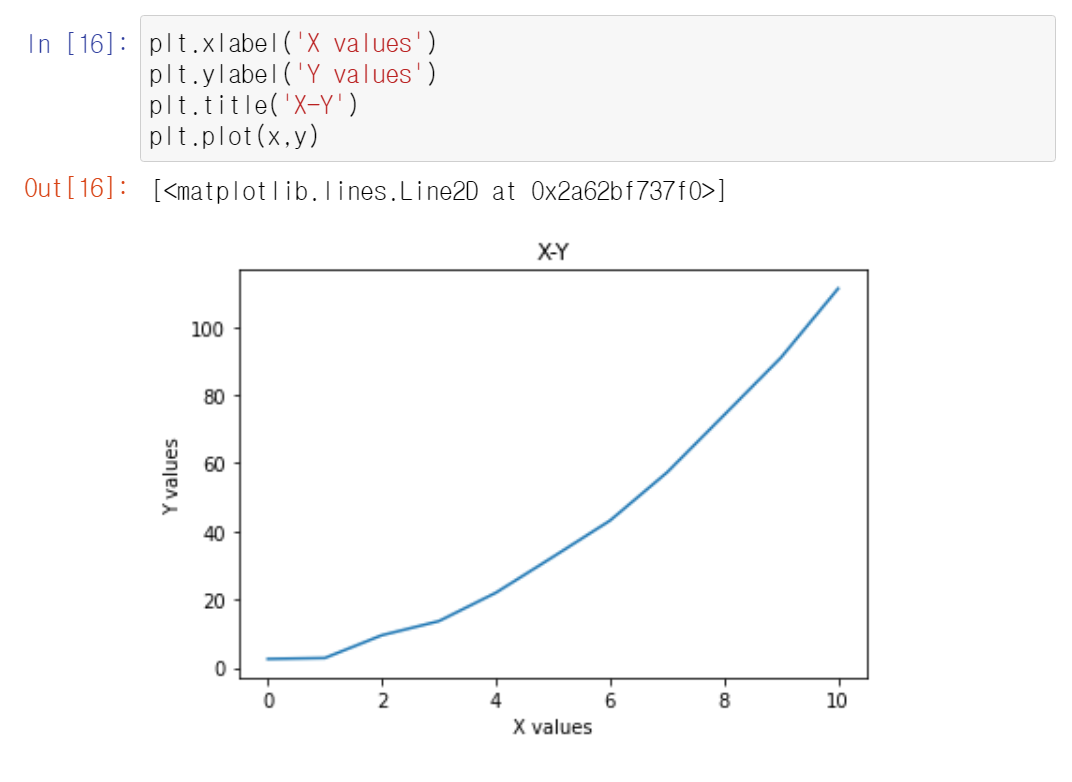
- 그래프에 주석 추가
- x,y 축 및 타이틀
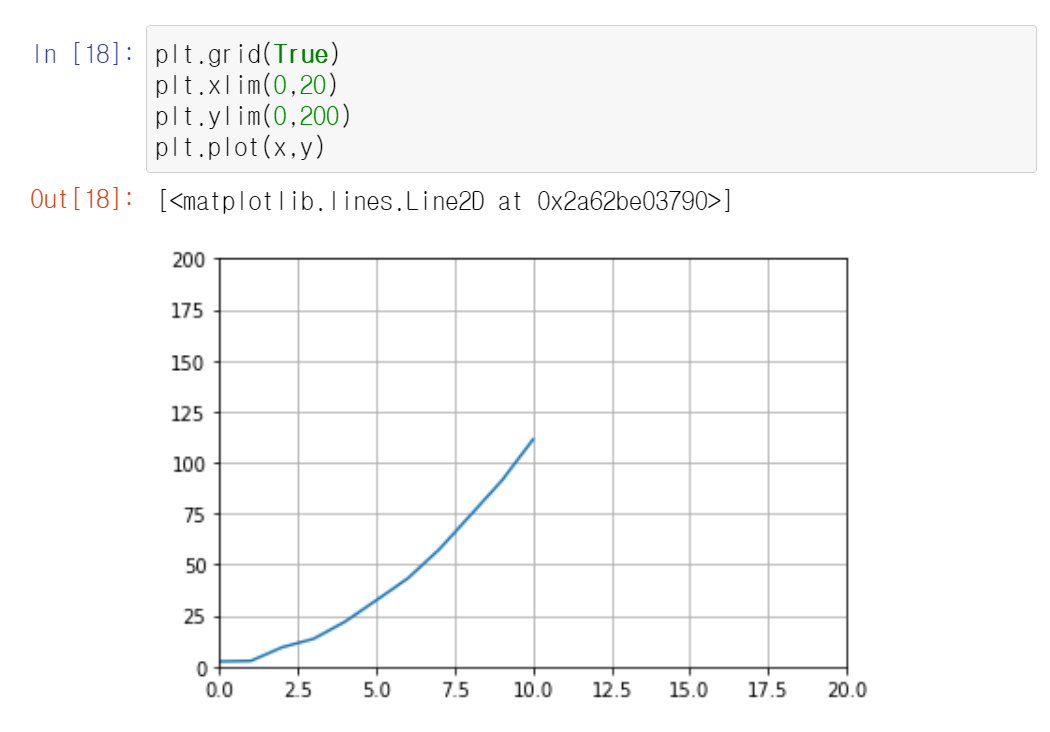
- grid 추가

- x,y 축 범위 지정
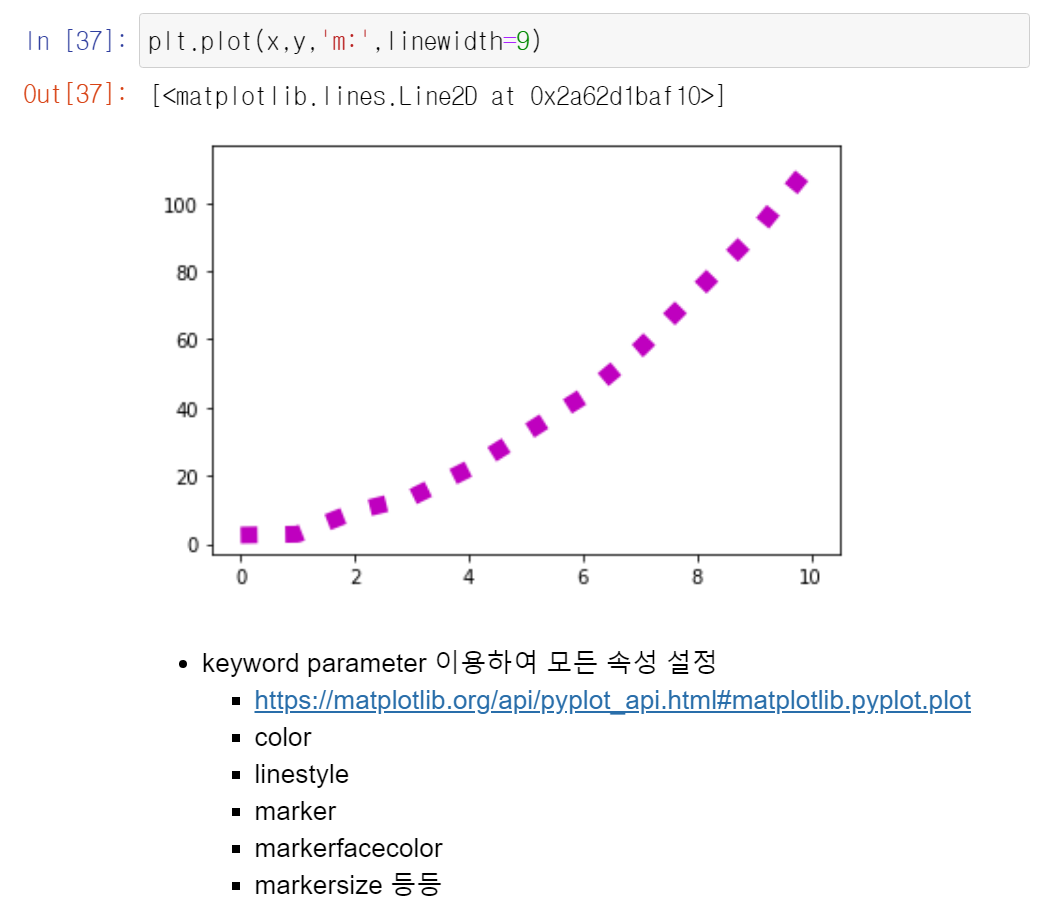
- plot 함수 parameters
- 그래프 형태에 대한 제어 가능
- plot함수 도큐먼트
pyplot — Matplotlib 2.0.2 documentation
Parameters:X : array_like, shape (n, m) or (n, m, 3) or (n, m, 4) Display the image in X to current axes. X may be an array or a PIL image. If X is an array, it can have the following shapes and types: MxN – values to be mapped (float or int) MxNx3 – R
matplotlib.org
- 그래프의 색상 변경
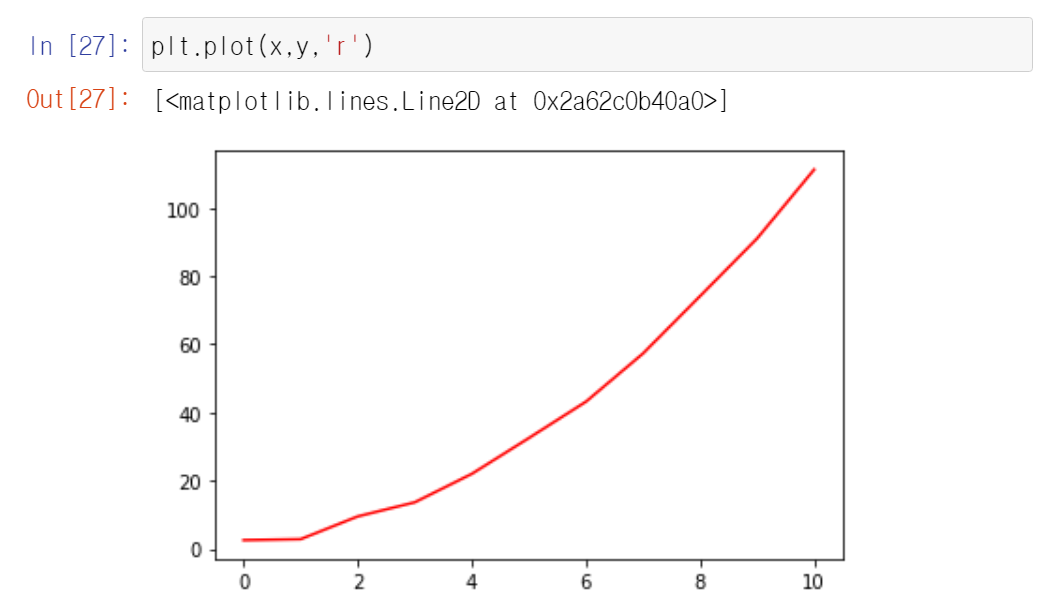
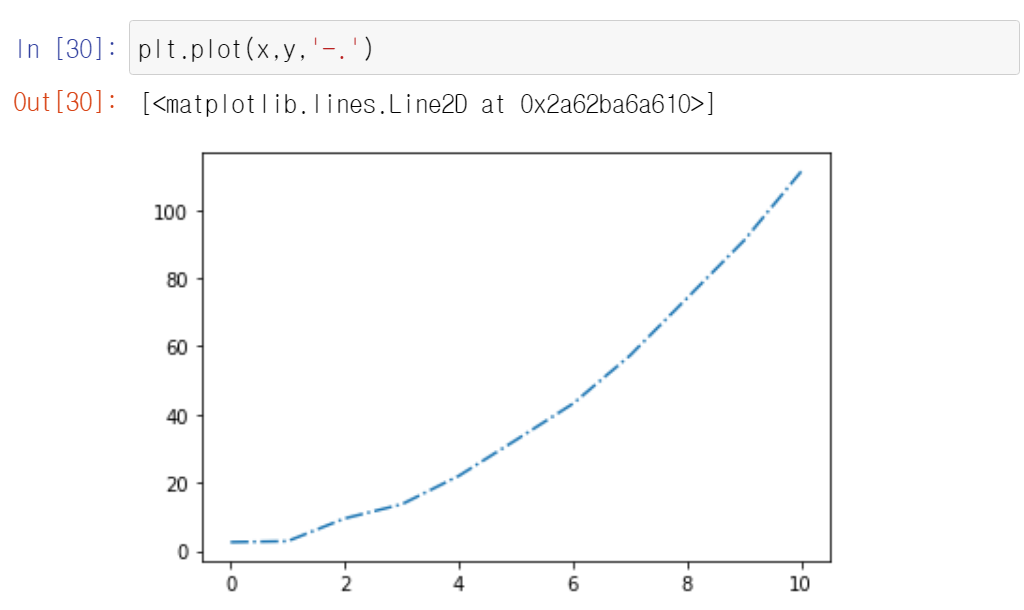
- 그래프 선스타일 변경


- 그래프 두께 변경
- linewidth 명시

- subplot으로 여러 그래프 출력하기
- subplot함수로 구획을 구별하여 각각의 subplot에 그래프 출력

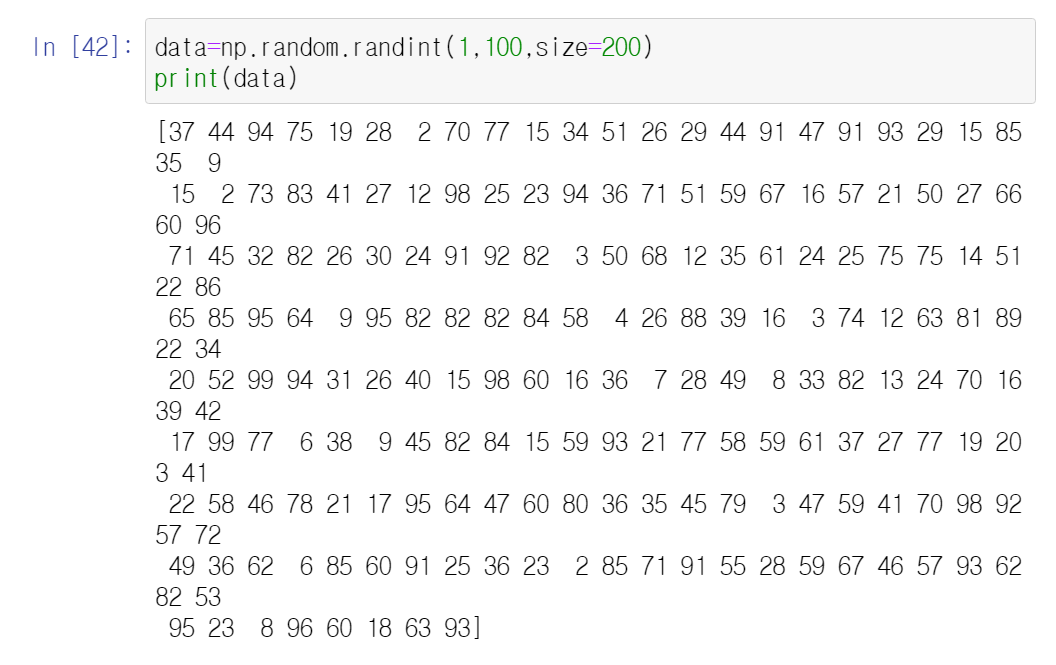
- hist 함수 사용
- histogram 생성
- bins로 histogram bar 개수 설정

'python > numpy' 카테고리의 다른 글
| linalg 서브모듈 함수 활용하여 선형대수 연산하기 (0) | 2021.03.29 |
|---|---|
| Boolean indexing (0) | 2021.03.29 |
| Broadcasting의 이해 (0) | 2021.03.29 |
| axis를 파라미터로 갖는 함수 이해하기 (0) | 2021.03.28 |
| numpy에서 자주 사용되는 함수 (0) | 2021.03.28 |